Won Lee, First 5 California
Aaron Sojourner, W. E. Upjohn Institute for Employment Research
Elizabeth E. Davis, University of Minnesota
Jonathan Borowsky, University of Minnesota
11/22/2024
2024 APPAM Research Conference, National Harbor, MD
Motivation and relevance 1
- In 2019, almost 60% of children under age 6 attended one or more weekly nonparental care setting (USDOE, 2021)
- States have adopted regulations that set minimum standards for child care facilities and programs
- Structural features of care settings thought to be related to quality and safety, such as Staff-to-Child Ratio (SCR)
- Policy relevance
- Understanding the role of regulation on the market is important as it might impact supply and price of care
- Increasing interest in expansion of child care by deregulation
- SCR strictness impacts childcare establishments through opposing forces
- #1: ↑ employment, ↑ service quality → ↑ demand for ECE ↑ Q
- #2: ↑ service costs → ↓ supply curve, ↓ demand for ECE employment ↓ Q
- #2a: ↑ service costs → ↓ affordability of ECE → ↑ alternative care ↓ Q
- The combined effect of these two opposing forces requires empirical investigation
Motivation and relevance 2
- Relatively few empirical studies
- Hotz and Xiao (2011)
- Establishment-level panel data on child care centers from 1987 to 1997, finds:
- stricter state regulation of staff-child ratios led to a decrease in the number of child care center establishments particularly in poor communities.
- improved quality of care proxied by the share of child care centers with national accreditation, particularly in higher income areas.
This study
- Re-examine Hotz and Xiao (2011)’s results using more recent data and three different quasi-experimental designs
- 1. Two-way fixed effects design based on the county-level data
- 2011, 2014, 2017 County Business Patterns data on childcare industry establishments, employment, and payroll
- 2. Border regression discontinuity based on small geographic unit data within 10 miles of the border line
- U.S. childcare provider’s exact location from Dun & Bradstreet (D&B) and estimates SCR effects focusing on fineresolution differences across state borders
- The effect of stricter regulations on the number of establishments, their payroll and number of employees
- 3. Synthetic control based on state-level data
- Aggregated from 2011 to 2021 data from County Business Patterns data on childcare industry establishments, employment, and payroll
- Exact date of the policy change is known and uses a synthetic control group approach
Summary statistics for county-level analysis

County-year level analysis: Effect of staff-to-child ratio on N of employees per 100 families, N of establishments per 100 families, annual payroll per Employee, and staff turnover rate

County-year level analysis: Effect of staff-to-child ratio on N of establishment per 100 families, by income tercile
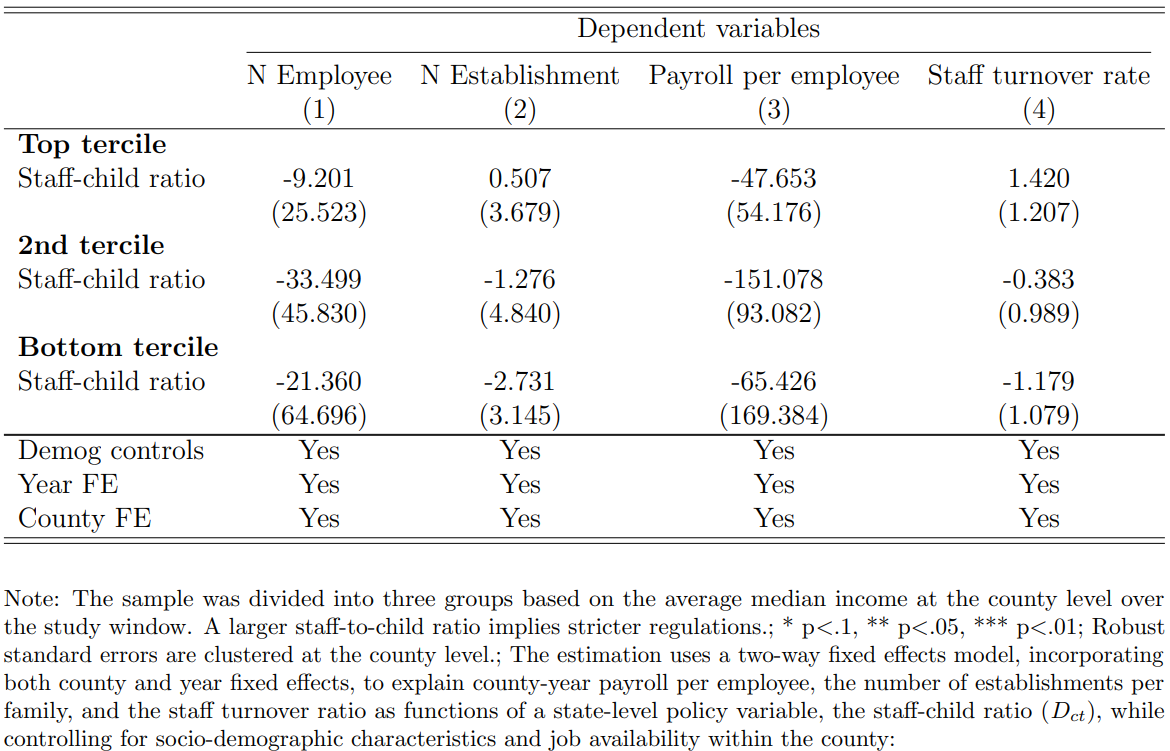
Illustration of zones near the state border with distance-based subzones
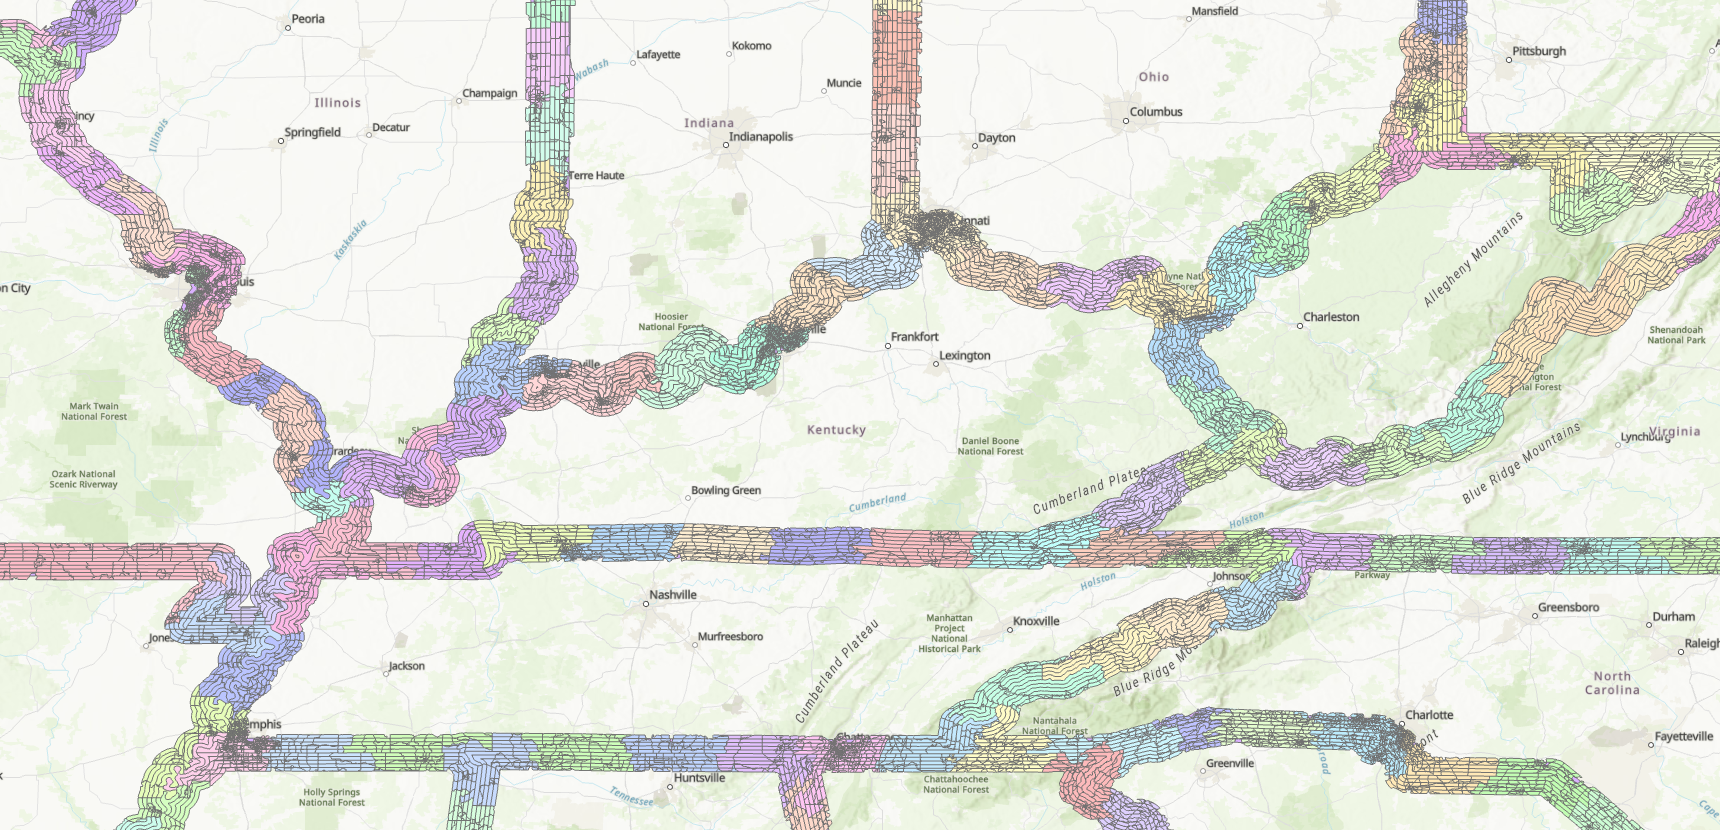
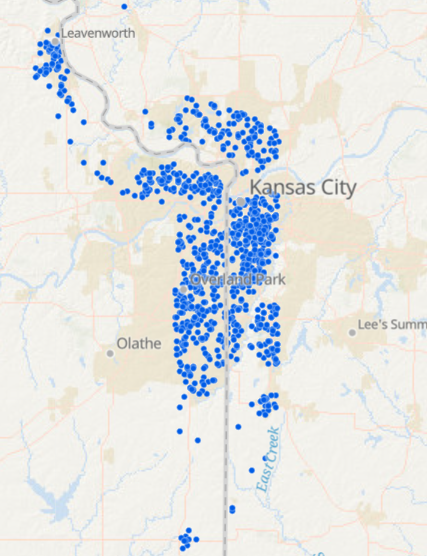
- Zones were created using the "Build Balanced Zones" tool in ArcGIS (Genetic Algorithm); parameters: number of zones, size, etc.
- Zones are adjacent to the state border, limited to a 10-mile distance from the border line. Each state-zone is further partitioned into 5 subzones (2-mile blocks).
- Provider-level data from D&B is aggregated to each subzone for analysis.
Summary statistics for regression discontinuity design
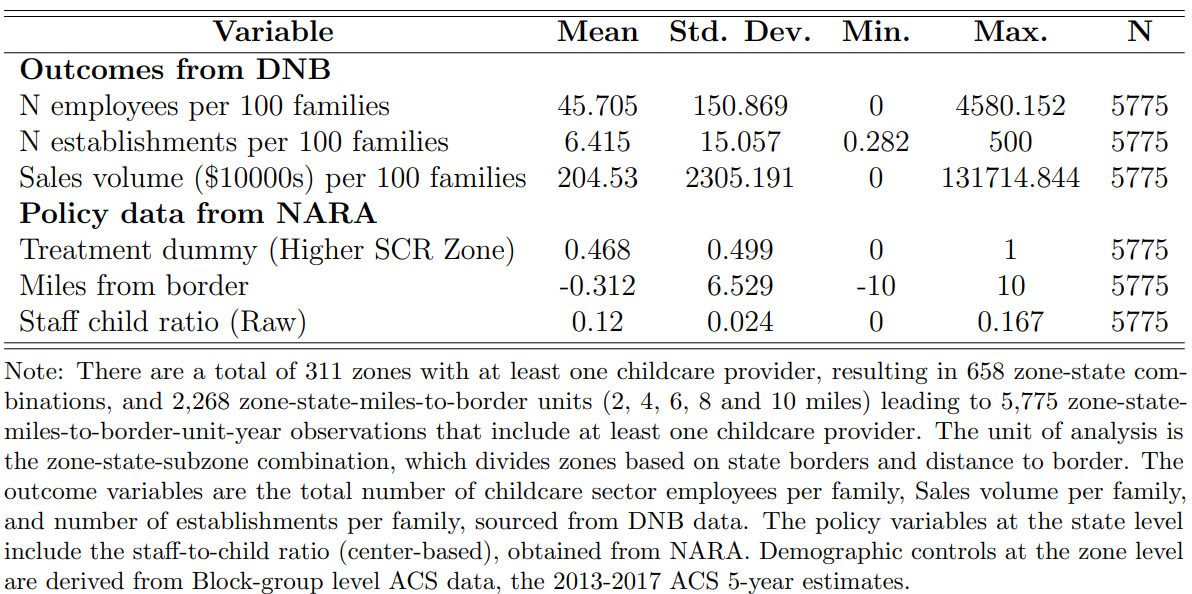
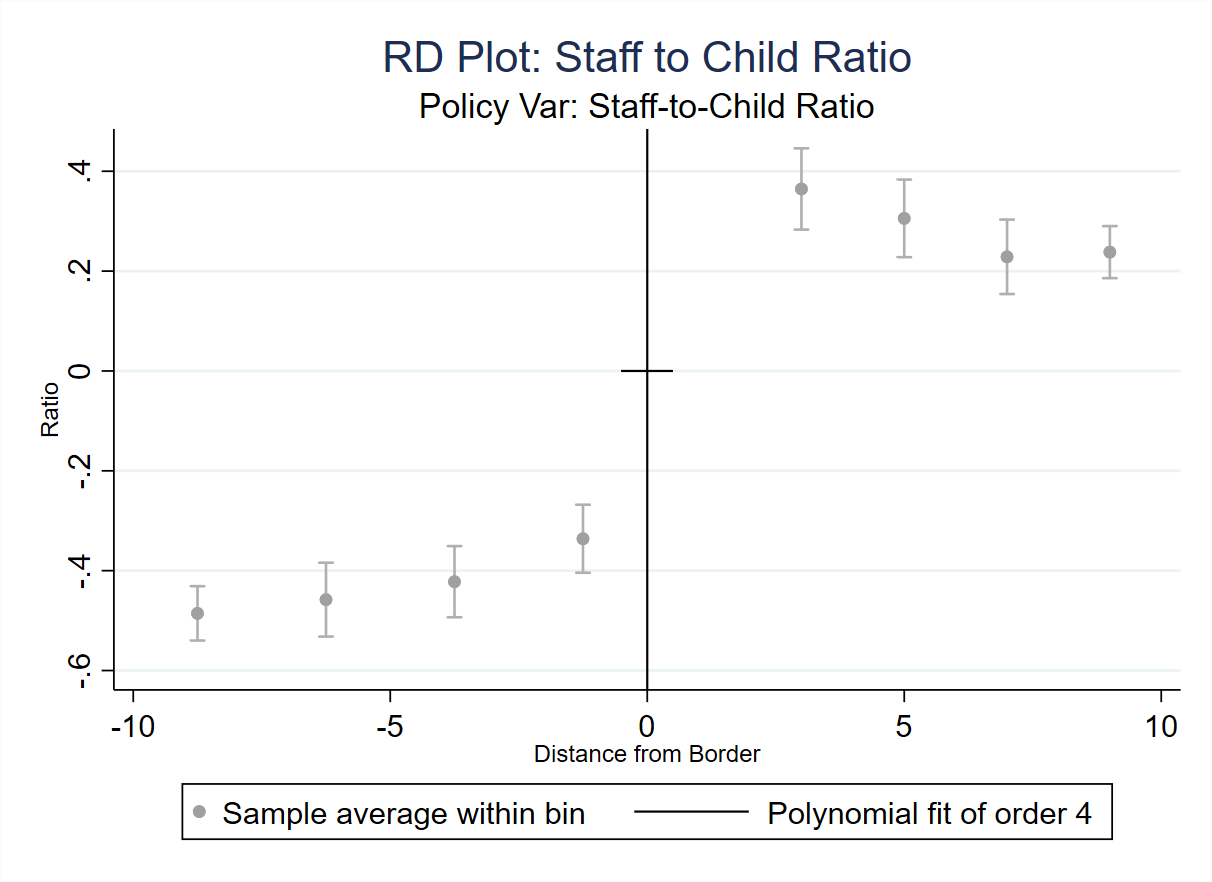
RDD analysis: Discontinuity at the border (Staff to Child Ratio)
RDD analysis: Discontinuity at the border (Outcomes)


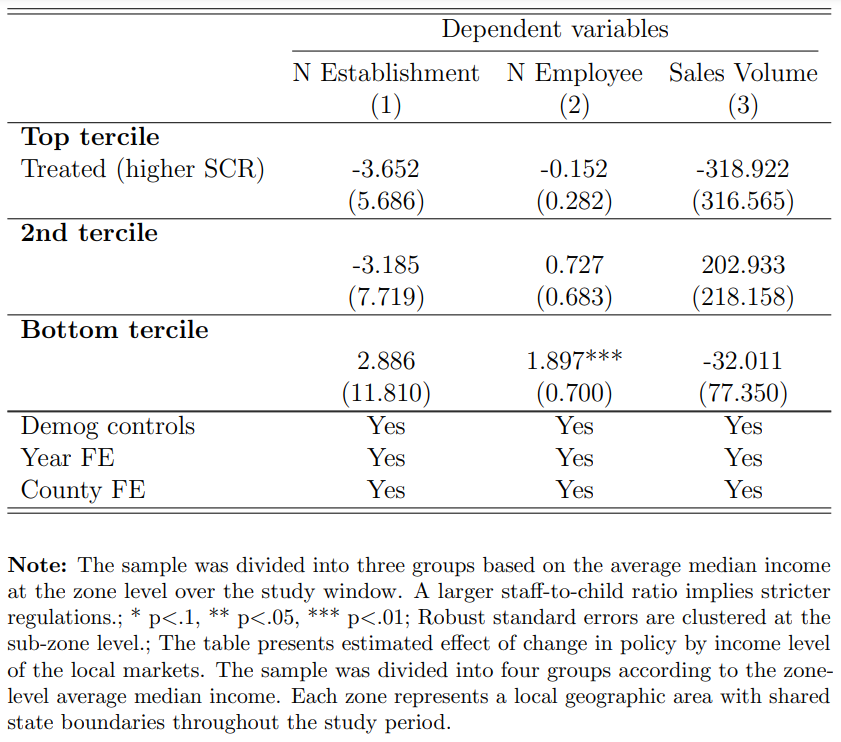
RDD analysis: Effect of staff-to-child ratio on N establishments per 100 families, N of employees per 100 families, and sales volume per 100 families, by income tercile
Synthetic control estimation - Louisiana policy change in 2015


Conclusion
| This Study | ||||
|---|---|---|---|---|
| Hotz & Xiao 2011 | County Level | State Border RDD | Synthetic Control | |
| N of establishments | (-) S. | (-) N.S. | (-) N.S. | (-) N.S. |
| N of Employment | n/a | (-) N.S. | (-) N.S. | (-) N.S. |
| N of establishments in low-income areas | (-) S. | (-) N.S. | (-) N.S. | |
| N of Employment in low-income areas | (+) S. | |||
| Payroll per employee | (-) N.S. | |||
| Staff-Turnover rate | (+) N.S. | |||
Note: S. indicates statistical significance at conventional levels; N.S., if otherwise.
- Analysis of data from 2011–2017 shows limited evidence that SCR significantly impacts overall market outcomes
- The signs of the estimates generally align with findings from Hotz and Xiao (2011), indicating that stricter policies increase service costs and reduce demand
- RDD analysis reveals an increase in childcare employment in lower-income areas
- Going forward, plan to add more years of data to increase power (requires identifying exact year of policy change)
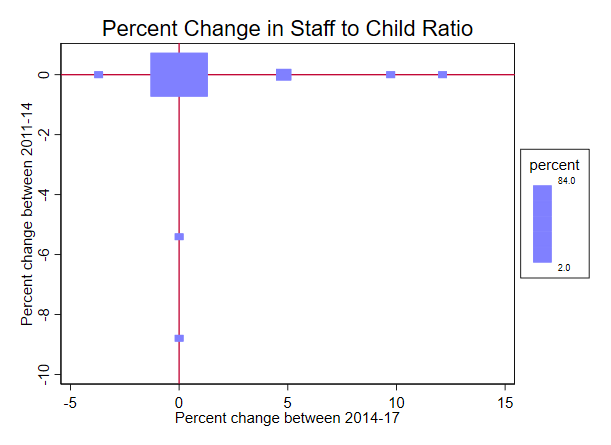
Appendix: Variation in the policy variable (Staff to child ratio)
Appendix: Hypothetical spatial distributions of providers near state border
by effect of state
regulation on supply location and population distribution
